Category Archives:
Digital Media

Read Part I: Sneakers, Fire Fighters, and McKinsey or Part II: Fun with DCFs and Stock Comp.

If you were a technology CEO, wouldn’t it be great if you could issue all the stock you wanted to employees without your investors minding a bit? That’d be pretty awesome. And what if those investors also rewarded you for controlling your cash operating expenses, especially in this time of bubblicious salary increases for engineers? I think you’d be pretty excited about that, as a tech CEO, or even one of the employees.

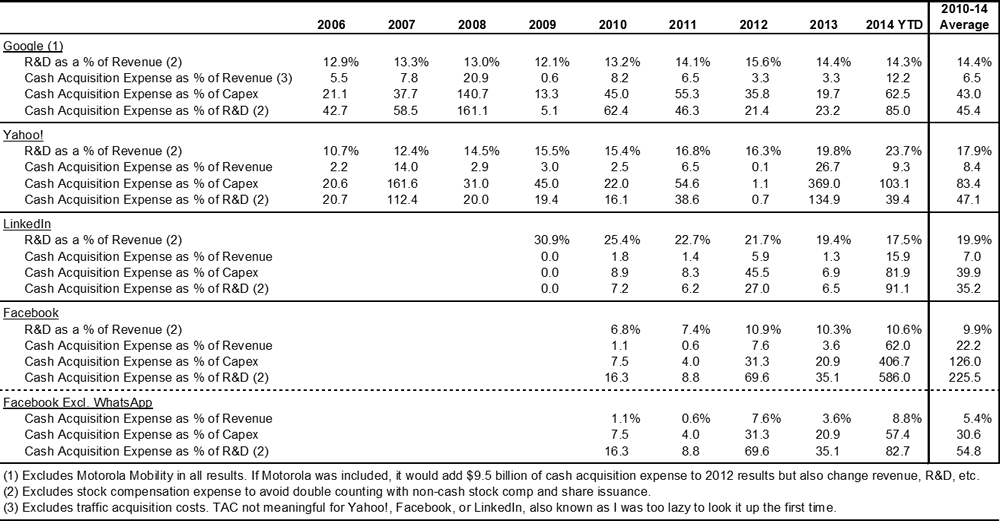
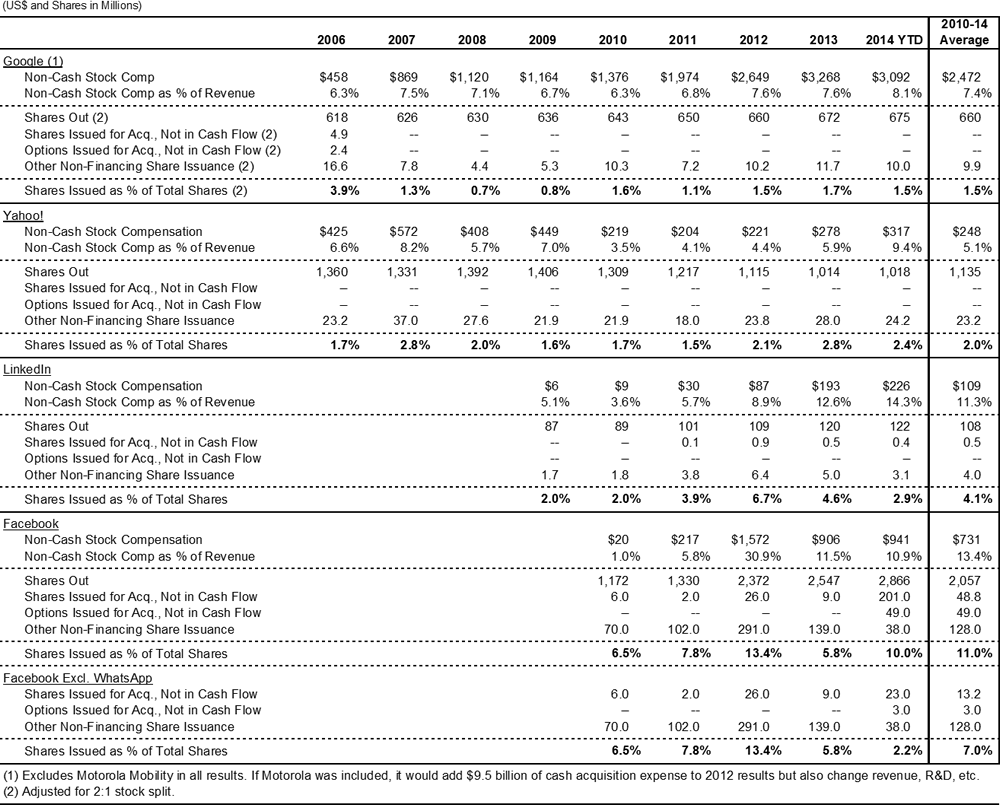
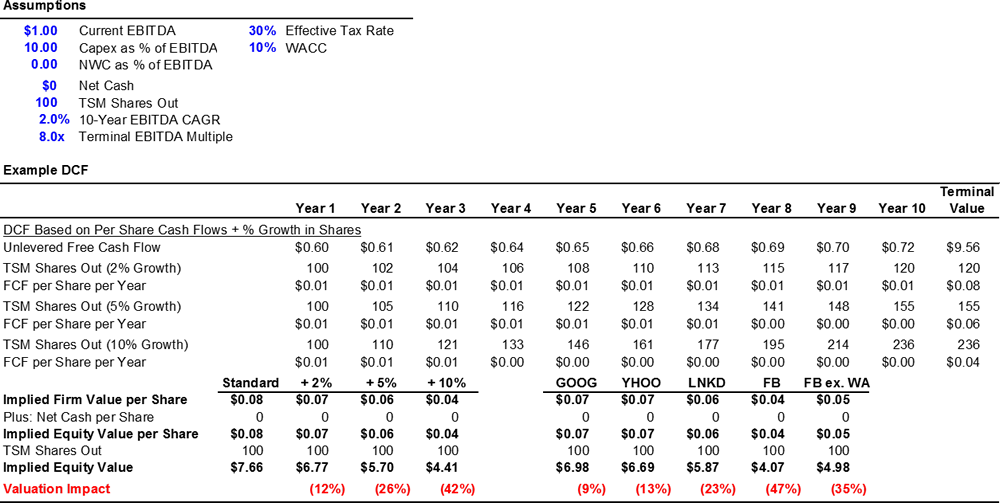
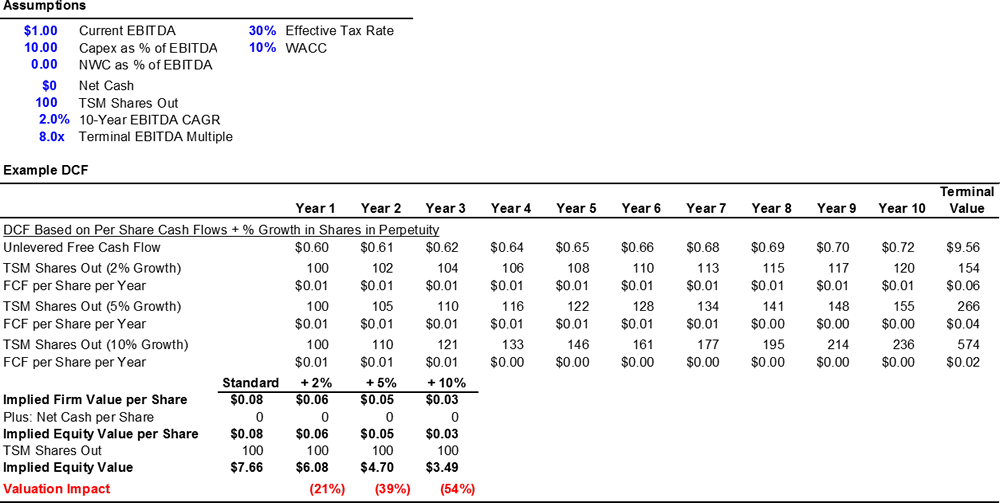
Previously I argued that today’s Internet companies such as Facebook and LinkedIn might be issuing more shares for compensation and acquisition to stay competitive in this environment. I then argued that adjusting valuation methodologies to account for continual equity dilution would result in major (25-50%) reduction in market valuation. Neither traditional DCFs nor cash EPS multiples capture the future impact of stock issuance or the cost of buybacks to keep dilution to a minimum, and I know from work as a research analyst that share counts are given short shrift.

But why do we ignore it? Is it because buybacks only happen on the cash flow statement (and below the traditional “line” too)? When it comes to acquisitions, is it because we no longer amortize goodwill making acquisitions look like either a revenue boom or an impairment bust? Or is it because some other accounting rule blinds us to the ongoing impact? It could be any, all, or something else.

I posited that many casual investors (and not-so-casual ones) might not appreciate the shift to restricted stock units (RSUs) that has become commonplace as a replacement for stock options in Silicon Valley technology companies. Being ignorant of the ongoing accounting for restricted stock compensation myself, I decided to dig more deeply for my own benefit and those of my seven readers.

Based on my research, I think that the permanent impact of restricted stock dilution isn’t reflected well enough in traditional financial reports, and we need to pay better attention to the growing levels of non-cash stock compensation when valuing companies absolutely or on a comparable basis.


Disclosure: Of the stocks mentioned, I’m still net-long Google, and net-short Facebook. I recently ended a net-short position in Twitter. The numbers are very, very, very small, because I have partaken neither in the Bay Area tech bubble nor Bay Area real estate one to a material extent. I’m also not a CPA, and my most important primary source has been this PwC report on accounting for stock-based compensation.

Disclosure #2: I’ve been working on this post for a long time between other projects, and I just want to get it out—hence no illustration. If there had been an illustration, it would have been titled “Clay Davis / ‘Whatever that was, they don’t teach it in law school.’” Maybe I’ll add it in the future.


Let’s start off with a short review of how stock options and RSUs work. I’m going to limit my analysis to public companies.[1]

For public companies, stock options are granted to an employee and represent an option (duh) to buy a share at an exercise price which is the current trading price of the stock. If your stock is priced at $10.00 per share when you are granted an option buy it, then your option has exercise price of $10.00 per share. At the time, your option has no intrinsic value to you. You could just as well buy a share on the open market for $10.00.

But options also have “time value” because you’re able to buy that share for $10.00 up to ten years later as long as you’re still employed by the company. This “optionality” has value, and math people smarter at stuff like this have developed equations using volatility and standard market returns to calculate time value that when combined with intrinsic value results in a FAIR VALUE for the option. This is what the option is worth on its own, as an option, before you exercise it. Maybe that fair value is $5.00, and we’re going to use that for simplicity sake.

RSUs work almost the same way. Instead of an option to buy, RSUs are a contract to receive a share, for free, just like, “Hey, nice job, here’s a share of stock and a $10 Chili’s gift card. Don’t spend it all in one place. Well except for the Chili’s card, where I guess you have to.” If that sounds different from an option, it should be. A granted RSU for a $10.00 stock has an intrinsic AND fair value of $10.00 as opposed to zero for the option. So an RSU is more valuable from the outset, and it’s also more secure. The downside of an option in our example is you get nothing, absolutely nothing, if the stock doesn’t go above $10.00. The downside for an RSU in our example is whatever the share price ends up being (which could also go to zero, but usually doesn’t).

Options and RSUs are typically granted in return for a period of service at a company, the option’s vesting period, an important thing to know if you’re valuing your options in light of the fact that you usually hate your job and want to leave after eighteen months. Vesting periods are typically four years (or 2.67x job hating units), meaning you receive 25% of your grant each year. If you’ve been granted twenty options, then you’d be able to exercise five of them each year. If you’ve been granted twenty RSUs, then you’d receive five shares of stock each year. If you’ve been granted twenty Chili’s gift cards, hook a brother up with some queso.

All of this should be pretty straightforward, even remedial, for anyone working in technology. Let’s go to the accounting to understand how things might get funky.


Since options and RSUs both represents something a company gives to an employee in exchange for work, a company must recognize the impact of this non-cash compensation on its financial statements somehow. Unlike cash which should have roughly the same value in a year, an option or an RSU could have significantly different value depending on company performance, not to mention different values from each other. The company is granting something in the moment (which has periodic income statement consequences) that may affect the permanent capital structure (that is, the capitalization table). The result is that companies account for stock compensation in two places: as a non-cash operating expense in the period on the income statement and the full grant’s relative impact to the diluted share count.

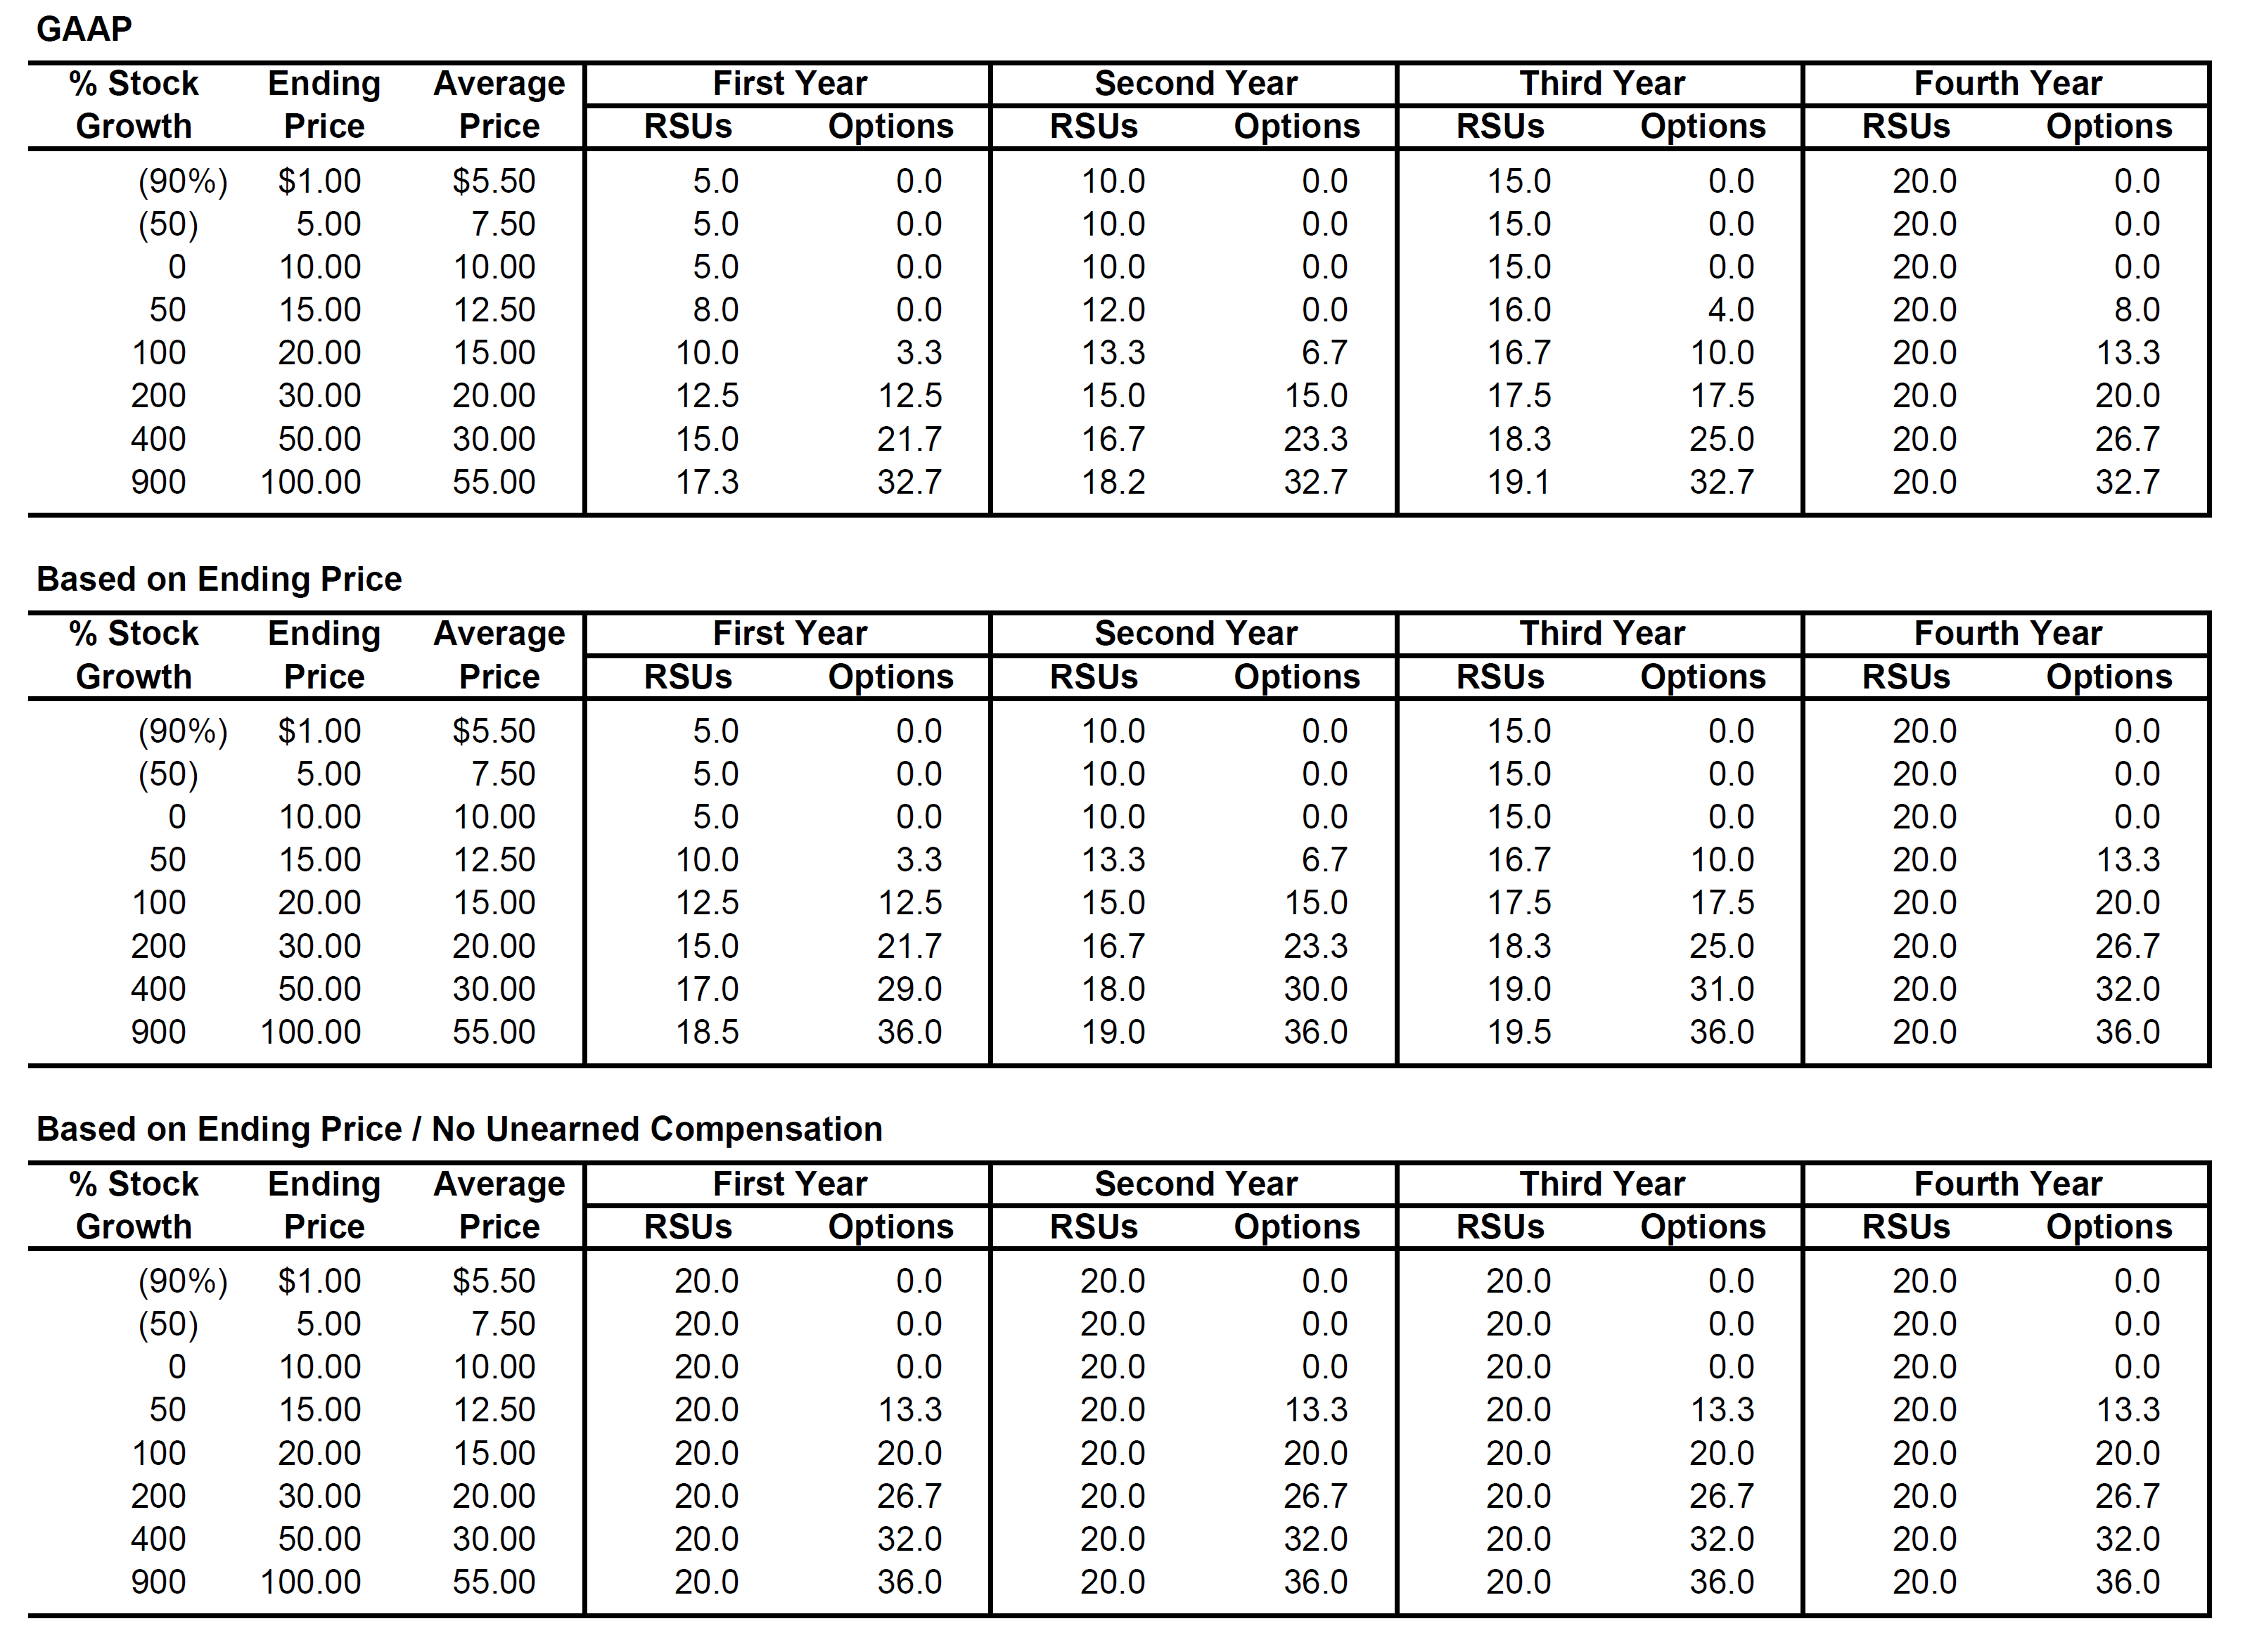
The periodic cash expense doesn’t change with the stock price value. Once you issue an RSU or an option, the stock compensation stays the same over the four years of vesting. You issue 20 RSUs at $10, that’s going to cost you $50 / year. You issue 40 options at a $10 strike price and $5 option value, that’s going to cost you $50 / year. The only reason non-cash stock compensation goes up is through the issuance of more equity instruments to more people, not through any stock price appreciation. And because a company can issue more options for the same price, the same dollar value of options will result in far more dilution as the stock price goes up, even if a single option will never be as dilutive as an RSU on its own. For the purposes of this example, the breakeven between options and RSUs is roughly at 100% price appreciation.

The takeaways from these past few paragraphs on accounting are these:

  • Non-cash stock compensation on income statements doesn’t go up just because the stock has appreciated; it goes up because a company is issuing more equity at that higher price
  • Options are more dilutive when the stock price goes way up.
  • RSUs are more dilutive when the stock price stays the same or goes down.

We also have to figure out what the impact is of the full grant to the diluted share count, which tries to take into account the impact of dilutive securities on the capital structure. The typical practice is to net out how many shares the company can buy back versus what it doles out; we call this the treasury share method. For options, the company can buy back shares with the value from the cost of exercising, the theoretical value of unearned compensation not yet recognized (more on this later), and any tax benefits. For RSUs, there’s no cost of exercising. For simplicity, we will ignore tax benefits from stock options and focus on the other elements of the calculation: the exercise amount and unearned compensation.

For RSUs, shares are automatically added to the basic share count as they vest, because there’s no exercise provision. In the prior example, you’d get 5 new basic shares each year. Similarly, for the diluted share count, we only have to worry about unearned compensation since there is no exercise price. You take the $150 the employee is still owed, divide it by the current average share price, and assume you’re going to have dilution of the total unvested shares less this amount.

And why do we use unearned compensation? No one explains it well, not even PwC. The best explanation I found was a website half in another language that suggests “unearned stock compensation is a type of off-balance sheet asset in a sense: it can be used to offset future compensation expenses without bleeding cash.” Yikes. That’s just not how people work, even if I understand the math / matching principle.

For options, we go through the same process, except the company receives remuneration in the form of the exercise price. Vested options aren’t added to the basic share count unless they’re exercised, in which case, a cashless exercise usually takes into account the classic treasury share method for calculation. Otherwise, you take unvested, unexercised options and subtract out the amount you can buy back at the average stock price. Simple enough. Except once again, you also subtract the amount you can buy back from unearned compensation. Huh? Yes, it’s just like restricted stock. Too aggressive if an employee is leaving, and too conservative if an employee sticks around. The only reason why unearned compensation may work as a proxy for employee behavior for either RSUs or options is that if a stock has gone up considerably, it’s even more likely that an employee will wait out his or her vesting.

Let’s try to summarize this area:

  • Fully diluted share counts don’t necessarily reflect equity issuance or what will happen. They reflect stock compensation that has already occurred and a best guess otherwise.
  • Unearned stock compensation is not the best proxy for future share forfeiture; it’s based on stock price even though companies make assumptions about share forfeiture for periodic stock comp expense.

You may have noticed something else about these calculations. They all take into account the average share price during the period. Which means if you issue an option with a strike price for $10, and the stock price goes up to $50 by the end of the year, you’re calculating dilution using a buy-back price of $30.

Option and RSU Comparison2

Again, if that seems to be unreflective of reality, that’s because it is. So let’s add another thing to this discussion.

  • The greater the stock price growth or decline in a period, the greater chance the share count will not reflect the operating reality of the capital structure.

In my research over the past few months, I’ve only found one guy talking about this. Professor David Doran at Penn State has been looking at these same issues and come to similar conclusions regarding the accounting. In his research published in the Journal of Applied Business Research in 2013, EPS would be more reflective of reality if companies used ending stock prices (a decision which FASB and IFRS came to in 2008 and then let sit probably because it was the hell that was 2008) and also if the diluted share count didn’t take into account the impact of unearned compensation as described above.


So what of this?

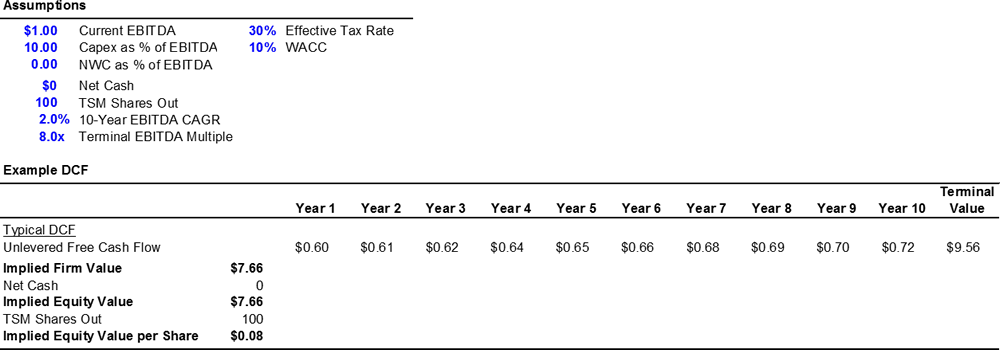
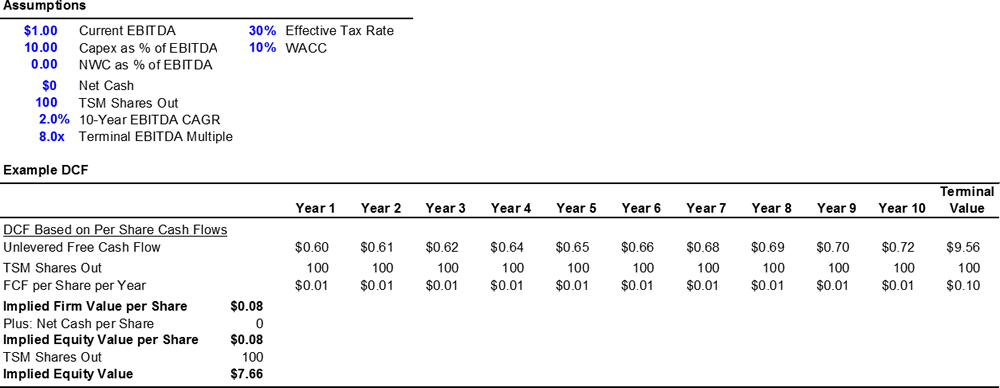
  • We already ignore regular stock issuance as part of our discounted cash flow valuation. See Part II.
  • We also ignore non-cash stock compensation as part of our multiple valuations assuming that the current share counts best reflect the capital structure. See, generally, Wall Street.
  • Our accounting rules aren’t great at reflecting the capital structure, and the faster the stock price growth, the worse our accounting rules are.
  • And while all of this is true regardless of whether a company issues stock or options, restricted stock looks a hell of a lot better on the way up to investors than it does on the way down.

In good times like we’re experiencing today, share prices go up while more shares get granted, vested, and issued. It may even result in a kind of multiple expansion as stocks prices get anchored to certain earnings levels despite rampant dilution. Of course, employees receiving these shares then spend their spoils on Bay Area real estate driving up home values and rents to the chagrin of everyone else who neither owns real estate nor receives free stock.

In bad times, the reverse happens. We don’t even know what a macro economic downturn will look like in a restricted stock era. Unlike unexercised options which will disappear as stock prices go down, restricted stock dilution is permanent for investors. Share counts stay the same while earnings go down and multiples contract. Plus those accounting rules that served companies so well on the way up will taketh on the way back down; using an average share price as the denominator for diluted share counts will result in a lot more dilution.

So then, what do you do? You might follow my new rule of “beware the growth stock that beats on EPS instead of revenue,” but otherwise, I will try to come back with some other… uh… options.

[1] Private company options work slightly differently due to valuations based on preferred stock and no consistent market valuation. I’ll talk about private company options at some point because I find myself advising lots of startup friends on their options.


ILLUSTRATION: Crop of Robots Attack the Morgan Stanley Building (2005) • watercolor & ink • 22×30″

Click here for Part I: Sneakers, Fire Fighters, and McKinsey.

Previously I decided to investigate whether the acquisition strategy of tech companies warrants a different look at standard equity valuation methodology. For this analysis, I’ve ignored eCommerce (which has its own particular challenges with standard retail comps) and focused on digital media: Google, Facebook, Yahoo!, and LinkedIn.

First, a disclosure: I own shares of/am long Google, and I own puts on/am short Facebook. This analysis doesn’t constitute investment advice, nor am I recommending or proposing any set of projections for these companies. This is but one analysis whose purpose is to show what a change in valuation methodology would do to your own company projections. Plus I might be wrong.

Second, a summary:

  • The dilution impact of regular share issuance, whether it be from an acquisition or from employee compensation, seems terribly underestimated in traditional valuation approaches.
    • Traditional discounted cash flows (DCFs) based on treasury share method share counts ignore projected new share issuance.
    • Investors ignore GAAP non-cash stock based compensation (which is, all things considered, still f***ing useless) and instead look to treasury share method diluted shares outstanding for EPS; the former fails to capture issuance timing while the latter ignores the compound effect of future issuance.
    • Analyst EPS estimates usually factor in additional share issuance, but these estimates naturally ignore the cash outlay of buybacks that help maintain shares outstanding.
  • As an example, using Facebook’s current share issuance trends, a traditional DCF would overvalue shares by 35-47% compared to the change in methodology I detail here. Eek. The data on Facebook is probably too thin at this point, but it remains an outlier especially when it comes to the use of stock compensation and stock issuance relative to its peers. That’s kind of what happens when you spend $17 billion on a freemium/$1 subscription business.

Company valuation is an inexact science, if you can even call it that. Knowledgeable and reasonable investors will absolutely disagree on the valuation of even the most mature of companies with the same set of financial projections. I’m pretty sure disagreement on financial matters is the second tenet of Buddhism after “existence is suffering.” For younger companies with higher growth profiles, like those of VCs, valuation and investing is akin to art, almost divorced from financial theory—a combination of golden gut/crystal ball dynamics, non-financial metric alchemy, anchoring bias, and general availability of dry powder, among other things. For both VC and private equity, the art/science of valuation is completely different from public markets and based on return rates.

However, basic finance theory (and common sense) tells us that the theoretical value of a public company is based on an assumption of its future cash flows. By discounting these cash flows back to the present, also known as a DCF, you generate that theoretical value. Since in reality, a public market investor isn’t going to get but a fraction of those cash flows (if ever) and since estimating a company’s next quarter is super difficult, let alone next year or ten years down the line, investors often use near-term earnings-per-share (EPS) estimates and multiples as a shorthand for valuation (or just pull it out of their ass). #TeamHumanities—just trust me on this, and perhaps enjoy the fact that “everything in this world, including money, operates not on reality—but the perception of reality.” (I knew I could connect this back to Sneakers.)

All valuation methods are imperfect and can/will be gamed. Most of the “one-time” adjustment games that go on in adjusting a standard accounting EPS to an investor-friendly one are well-known and accepted due to accounting rules that can distort what’s going on operationally (to a degree). Whereas DCFs are often treated like black boxes and, as such, obfuscate valuation especially for high-growth companies with large terminal values when capital is cheap. With any skill, a finance-type can make a DCF stand up and whistle Dixie if he or she wanted.

Timeo argentarios et DCFs ferentes[1]


Download the Excel spreadsheet referenced herein.

When I started this analysis, I had wanted to see if the use of acquisitions to replace R&D was a distortion being ignored in typical valuation methodology. Here were the assumptions I wanted to test:

  1. Are digital media companies acquiring others for technology that ostensibly would have be developed in-house?
  2. Are digital media companies spending less on R&D and more on acquisitions?
  3. What would be the valuation impact of projected acquisition expense on EPS or a DCF?

To begin I looked at Google’s and Facebook’s acquisitions that have known deal values, and I tried to sort them into either businesses that could have reasonably been developed by an internal R&D team or businesses that would have been a stretch, that feel more like adjacencies or new business lines. For Facebook, an example of the former would be WhatsApp or Instagram, and the latter would be Oculus VR. For Google, an example of the former would be AdMob, and the latter would be Nest. This wasn’t a particularly good analysis, and all it did was confirm my confirmation bias that Google tended to spend money on new business lines and Facebook tended to spend money on existing ones. Bah. You could make a case that Facebook was spending a kind of maintenance capex, but what of it?

So I pulled an analysis together to see whether acquisition expenditures even mattered financially, which is probably where I should have started. How does cash acquisition expense impact free cash flow margin, for example? Or how does cash acquisition relate to R&D expense?

BVII-Chart1

Excluding that crazy Facebook/WhatsApp deal, it seems cash acquisition expenditures historically represent a 5-10% impact on free cash flow margin. It’s a minor distortion, roughly equal to 50% of capex or 50% of R&D spend—something, but nothing ridiculous, especially given the margin of error (not used literally here as in statistics) in most DCFs. And there’s no real way, other than a constant non-cash goodwill impairment, to recognize the cost of an acquisition in EPS, so you have to assume that it’s baked into the P/E multiple assumption as a change in the underlying cash balance/capital structure.

The next step was to understand the impact of stock deals obviously not reflected explicitly as acquisitions on the cash flow statement. Most deals for these companies are cash, and many filings lacked sufficient information on stock or options issued specifically for acquisitions. So I decided to track overall share issuance, and overall share issuance happens to be a lot more interesting.

BVII-Chart2

In this chart, I’ve tracked the dilution of all non-financing share issuance against the total shares outstanding. Google clocks in at an average of 1.5%, Yahoo at 2%, LinkedIn at 4%, and Facebook at 7% to 11% depending on whether you include or exclude WhatsApp as a one-time, Black Swan event. I’m going to give Facebook the benefit of the doubt since they’re a young company.

Still you might think, so what? Who cares about 2% dilution? My cost of capital gets cheaper every time the Fed speaks. Here’s the rub: a 5% decrease in margin that flows through to free cash flow every year has a roughly equivalent impact on valuation depending mostly on the terminal value, but a 2% increase in shares outstanding each year has a compounding impact much, much greater.

Shares are forever, at least until they’re bought back. Let’s take a look.


For simplicity, I’ve built a DCF with $1 in current period EBITDA, 10% capex, no working capital adjustments, a 30% effective tax rate on EBITDA, a 8x terminal multiple, and a 10% weighted average cost of capital. I’ve ignored deferred taxes or tax benefits for stock options, and this scenario implies a 2.3% perpetuity growth rate for free cash flow which is perfectly cromulent. I like using $1 for EBITDA in sample DCFs because the valuation and current valuation multiple are equivalent as you are dividing by one. Plus you strip away all the pretense and black box nature of typical models. You can pretend this is any company where 1 = 100% of current EBITDA.

BVII-Chart3

In most DCFs to get to an equity value per share (after net cash adjustments) you circularly divide by the treasury share method diluted share count with the implied equity value per share as an input for cashless exercise. It’s a perfectly acceptable way to represent the current moment in time. You can also look at the free cash flow per share in the forecast period and resolve to the same valuation.

BVII-Chart4

However, we discussed earlier that diluted share count misses two things that seem to be a matter of course: the shares issued in future acquisitions, and the options/restricted stock granted and exercised year-in, year-out. I’ve built this capability into equity analyst DCFs before, but 1) I’ve only ever turned it on for forecast EPS estimates, and 2) I’ve never thought the dilution rate was so high. We used to forecast 1%, not 7%.

So here’s that same free cash flow per share analysis with 2%, 5%, and 10% growth in shares over the forecast period. You discount the resulting free cash flow per share back to the present, adjust for the capital structure, and then you multiply by the CURRENT treasury share method share count (based on your implied equity value per share) because you’re trying to figure out what a share today is worth. Those share growth assumptions have a compounding impact on valuation of 12%, 26%, and 42% respectively.

Again, shares are forever unless they’re bought back (which happens… a lot).

BVII-Chart5

I’ve also shown what that valuation would look like with the selected companies’ respective average share issuance per year. Facebook takes a 35-47% valuation hit if you assume they continue to issue shares as they have recently. I don’t think they will, but it’s a helpful guidepost.

The above analysis is based on keeping shares at a steady state once you reach the terminal year. It’s way scarier if you assume that shares continue to grow. See below.

BVII-Chart6

Ugh.

Stock compensation is a great deal if you work for these companies. You issue more and more shares as a percentage of compensation, and your stock price still goes up because it looks like you’re improving your margins.

And just in case you were wondering, higher terminal multiples, higher CAGRs, and lower WACCs all result in worse dilution. It’s like a perfect bubblicious storm when return rates and WACCs diverge.


Entrepreneurs and venture capitalists fight for every share and option issued. It’s a zero-sum game. Every share issued takes $$$ away from someone else. So what gives in the public markets? Why do so many investors turn a blind eye to the ongoing shift of compensation from cash to stock because it’s a non-cash accounting adjustment at the outset? I guess I was guilty of this mistake as well in the past.

Investors also clearly understand how future maintenance capital expenditures work. We tend to ignore that acquisitions can serve a similar purpose, to maintain a position, to defend against market share loss, to stifle a future competitor. (And yes, some acquisitions are different. YouTube basically evolved into a new business for Google and probably generated $2 billion in revenue after TAC last year based on an analysis I did for Jefferies this year to estimate YouTube’s financial model since acquisition. But I also estimate Google spent $6+ billion in addition to the $1.65 billion acquisition to get to that revenue level.)

If my logic and math hold up, then between future “maintenance” acquisitions and stock compensation, we might be overvaluing some tech companies by 20-50% or more relative to whatever set of projections you’re using.

It makes you want run to the window and scream, “I’m mad as hell, and ‘Pro forma’ doesn’t mean what you think it means! I took Latin! And pivot means the same thing as turnaround, for goodness sake!”

Not that I’ve done that.


If I can bring myself to do a third post on Bubble Valuation, I’d like to investigate maybe why we ignore these distortions. I’ve posited a few reasons…

First are the accounting rules around GAAP non-cash stock based compensation. For example, Non-cash stock based compensation matches with grants instead of issuance, and its calculation inherently ignores the fact that equity is most valuable to an employee when the stock price is lower and set to rise. Moreover, I would like to see if the move to restricted stock has anything to do with how it’s accounted for at grant price vs. a Black-Scholes-Merton method for traditional incentive stock options.

Second are the accounting rules around amortization of goodwill. Could goodwill’s lack of presence on the P&L inure us to ignoring its effect on the balance sheet? Can you impair something that never makes money if it never made money in the first place? I don’t really know (and I’m happy for someone to tell me, so I don’t have to look it up).

Third is a qualitative/strategic/historical look at why Google and Yahoo and Facebook’s businesses may be different even when they compete for the same advertising dollars. What parts are yellow page/classified-like utility and what parts TV/radio-like media consumption? How will that influence steady-state margin?

That said, I might need a break. Please let me know whether you’re interested in this, have any other ideas, or you’d rather just see more robot cartoons…

[1] Roughly: “Beware bankers bearing DCFs.”

ILLUSTRATION: Legion of Doom in Las Vegas • watercolor & ink on paper • 5×7″

Click here for a more analytical Part II: Fun with DCFs and Stock Comp.

My parents believed in conspiracies. It was a manifestation of distrust of power in any form. If you think about it, the stories behind events like Watergate or Iran Contra are so batshit as to compel a generation to develop conspiracy theories for just about everything. Fool me once, right?

So I remember them cheering every line by Dan Aykroyd’s character Mother in the 1991 film Sneakers, from claims about faking the moon landing to the CIA’s involvement in the Managua earthquake. Not necessarily because my parents believed the theories, but rather because it gave voice to a seemingly logical, yet underrepresented, distrust in government (before the web provided a bullhorn for nutjobs, of course). One of Sneakers’ many successes comes from balancing Aykroyd’s out-there conspiracy theories with Sidney Poitier’s frustrated reaction for comic relief all while the heroes themselves are caught in one of those out-there conspiracies. If you haven’t seen it, do so—I’m not the only one who feels this way. Sneakers is subversive without seeming so, with a postscript that generates a kind of fictional universe dramatic irony where we know more about the world than its population.

And that’s exactly what’s so compelling about conspiracy. Conspiracy allows us to structure narrative where there is none, to believe ourselves smarter than the horde at large, to recognize a subtext that others have clearly missed. Conspiracy is awfully good at bringing order to what is merely chance—a universe determined by the decisions of millions of people often disinterested in anything other than themselves. Conspiracy can be a shorthand for a mess of incentives and the folks who have benefited disproportionately—at least that is when the conspiracies don’t involve alien abductions or Kenyan birth certificates.

Viewed in this way, conspiracy might come from a cynical, untrusting place, but it’s idealistic in nature. Somehow vast as in “vast right-wing” or “vast left-wing” only involves a relative handful of selfish people looking to bend the world to its will instead of a massive number of selfish ones looking to get while the getting is good. Evil might indeed be banal, but in a conspiracy, evil is the realm of supervillains, not your neighbors.

Shit, it’s also probably comforting to think that there’s someone, somewhere in charge, even if their results aren’t very good. Returns regress to the mean, after all.


Imagine a system where highly-paid Ivy League grads invested public pension dollars into investment firms run by even more highly-paid Ivy League grads?

Imagine if these firms invested in a lot of companies run by other highly-incentivized (if not also highly-paid) Ivy League grads who then sold their businesses for a ton of money to public companies run by other highly-paid Ivy League grads?

Imagine all of those folks switched roles all the time from LP to GP to startup CEO to large company CEO and back.

Imagine a system where it appears that a ruling class makes a lot of money and a large number of folks work earnestly yet unsuccessfully for high-risk lottery tickets to join it.

Ugh. Of course, of course, that’s not exactly how venture capital works. It’s just money. It’s just incentives. But imagine what it might look like to someone outside the system. You know, someone who’s priced out of San Francisco real estate and calls into Michael Krasny’s Forum on NPR.

It might look like a cabal, like a conspiracy.

Even if it’s not.


In 2007, a senior advisor for the private equity and venture capital firm where I worked asked me rhetorically, “Do you know why so many of the presidential candidates are in DC today?”

The International Association of Fire Fighters (IAFF) was holding a presidential forum, and each candidate from each party was coming through to appeal to the union ahead of important March primaries. With more than 300,000 members in 3,200 locals, the IAFF reached almost every community in the United States. Hence the forum was more important than any state a candidate could be visiting that day instead.

“Now compare that to this so-called Private Equity Council which only has six members.”

He had clearly made this argument to others in the firm without success that creating an organization to represent six members with hundreds of billions in capital could only galvanize public opinion against its causes. Act alone, and you may fly under the radar (or you may not). If you do organize, certainly don’t tout it. An organization of six kajillionaires arguing for tax benefits for carried interest doesn’t look like a union to the public.

It might look like a cabal, like a conspiracy.

Even if it’s not.


In 1999, The New Yorker published an essay by Nicholas Lemann called “The Kids in the Conference Room” later collected into a fantastic book called The New Gilded Age: The New Yorker Looks at the Culture of Affluence edited by David Remnick. I found my copy among twenty-five sitting on a shelf at Morgan Stanley because of another collected essay entitled “The Woman in the Bubble” about my boss at the time.

Lemann discusses the rise of McKinsey & Co., and in general management consulting and investment banking, as the stepping stone par excellence for elite college grads in the 1990s. As Lemann describes mordantly, “To get a business analyst job at McKinsey is to add another glittering credential to your string, since you’ve beaten out so many people to get the job, and working there offers the comfort of knowing you’ll be among your own kind (applicants have to submit their SAT scores). The world’s infinite possibilities haven’t been reduced by a whit, only enhanced.” Of course, elite colleges (and elite pre-schools) benefit from serving as the gatekeeper to these elite careers. Higher tuition, larger endowments, plum administrative salaries—sending kids to McKinsey instead of to study Italian neorealist films or the lexicon of Finnegan’s Wake in grad school has its distinct financial advantages.

And you can’t help but giggle now at Lemann’s prescience when he argues “the consulting vogue won’t last forever” given the late-90s pull of technology startups with “young hot shots … standing in the office of their converted warehouse space waiting for their IPO money to roll in.” However when the bubble inevitably pops, “technology will begin to look, to Ivy League seniors, risky—really risky, not just acknowledged-as-a-grace-note risky.” 2010s take note.

Lemann ends, fittingly, with a McKinsey-style three bullet point summary. The McKinseys of the world “stand at the end of a huge system that sends tens of millions of people to American public schools every year, administers the SAT to two million people, and processes more than a hundred thousand applicants to Ivy League colleges—all of this done either directly by government or by non-profit organizations subsidized by government—and then they pluck its very ripest fruit.”

It might look like a cabal, like a conspiracy.

Even if it’s not.

It’s the shorthand of incentives and long-term trends all ascribed to the particular actor currently benefitting disproportionately. No one set out to conspire for this to happen. It just kind of did. Incentives. Luck. Privilege. Maybe the hard work, wits—and greed—to take advantage.


In Silicon Valley these days you’re apt to hear that unlike the last bubble in 1999, many companies make real money. And of course there exist a large number of successful, profitable enterprises that can clearly re-invest in important employee retention perks such as lap pools and Halloween carnivals. At the same time, there are a number that aren’t yet profitable or won’t be able to sustain their current revenue or their current opex without additional financing made possible by extremely cheap capital happy to chase growth (Hello QE4!).

The current sentiment (eep… sarcastically summarized as “it’s different this time”) also assumes there weren’t companies making money back in 1999 or thereafter when things were pretty ugly. That every company was Kozmo.com. But in the lead up to Google’s IPO in 2004, I remember rebuilding the valuation models for The Woman in the Bubble’s team at Morgan Stanley with some shock at how reasonable some of the winners’ financials were such as Yahoo! and eBay. Certainly there were some stinkers like Ask Jeeves and CNET, but not all of them. You could definitely build a DCF to support a theoretical valuation. Like today, those valuations were based on long-term cash flow growth and market expansion and new products and the outright destruction of traditional industries as we know it.

For all the excitement of today’s companies making real money because of “network effects,” “software eating the world,” and, come on, “app install ads” and “monopolies”, there’s also this latent fear that popular services will stop being popular because some other service has become cool—if not less popular with consumers, then less popular with the fickle advertisers who foot the bills. It’s the other side of the coin to “disruption.” (Ick, I feel gross using that word.) To put it another way: wasn’t Facebook also supposed to be Instagram without paying $1 billion for it?

What if “Internet companies” have to be acquisitive now? Not just for growth, not just for accretion, but as a matter of course, to replace future product development? What would happen to public Internet valuations if acquisitions were considered a form of maintenance expenditure like capex? That’s the hypothesis I want to test. What if overvalued acquisition currency is the type of misplaced incentive that’s too-clever-by-half and looks incredibly shady when the bubble pops?

You know, like a conspiracy.


So. Imagine a system where large companies realized that lower barriers to entry created so much market noise that traditional R&D investment broke? Not in core products, per se, but in new products and adjacencies. Perhaps even the success of core products didn’t last as long as people once modeled.

Imagine if the odds against creating a successful new product were so high that large companies decided it was cheaper to buy the most successful startups rather than invest in core R&D? Especially if they could buy startups with overvalued equity. A steady supply of battle-tested companies would be nice.

Imagine if there were a large, underemployed generation of 20-somethings who each believe they should be CEO and focus on “strategy?” Like all inexperienced 20-somethings before them, by the way. And there was ample cheap capital from incentivized VCs/angels/incubators to allow our 20-somethings to each become founder and CEO of his or her own shitty startup.

Imagine our founder and CEO plays company 100+ hours per week for a modest salary and lottery ticket promises, even though the features she’s working on would be the responsibility of an assistant junior product manager at a regular company. But she gets psychic CEO benefits while waiting for a table for two hours at Country Fowl Comestibles.

Imagine if a cottage industry grew up around “foundering” supporting product press releases, celebrating failure, teaching hacking, selling hoodies, and providing on-demand snacks? “Foundering” could become the awful entrepreneurial cousin to Gawker’s concept of “writering.” Do you want to just fill-in-a-blank on a generic convertible note rather than deal with pesky lawyers or negotiations or even f***ing understanding the difference between equity and debt? We could make that happen.

In the end, imagine 1% of our junior assistant product managers/CEOs win the startup lottery and join that rarefied air of true executives, VCs, GPs, and LPs. And the other 99% of founders founder along until they found a winner. Mathematically, it only takes a hundred tries, a hundred hours per week, another hundred thousand dollars in angel investment.

The Problem With Ad Tech

ILLUSTRATION: How Is That Robot Making So Much Money? • watercolor on paper • 5×7″

What’s that? THE problem, you say? Aren’t there lots of problems with ad tech?

If you work in ad tech, chances are right now you’re “fixing” data for the client while marveling at the number of jeans parties your sales team has thrown this quarter.

If you’re a media company or an advertiser, you’re scratching your head at the most recent pitch from a BD guy in taper jeans and a blazer who last week was pitching you on a different solution.

If you’re a consumer, maybe you’re wondering why that inappropriate purchase you considered at Amazon is following you to The New York Times when you bring up an article to show your team in a meeting? (It’s okay though. They missed the embarrassing retargeting ad because they’re ridiculing you behind your back for citing Thomas Friedman.)

If you’re an investor, you’re worrying that you’re the last one in—the sucker at the table—since the best returns come from private market acquisitions when markets are nascent (a fine vocabulary alternative to “early innings”).

The biggest problem with ad tech, though, is that it represents a taking from consumers without a fair value return. Unlike media companies who, in exchange for a word from their sponsors, give you something—content, entertainment, a brief diversion from your miserable existence—ad tech companies give consumers, in exchange for their personal data, close to nothing.

[Conflicts and bonafides, first: I’ve built a company in ad tech, specifically mobile video (although we were loath to call ourselves ad tech, since we tried not to do what I’m about to describe). I have lots of friends in ad tech. I helped take Google public back in the day for Mary Meeker. I’m short a bunch of high P/E digital media stocks. I also write a lot about digital media here on this blog and professionally in my consulting.  My most recent consulting project on YouTube was done in conjunction with Jefferies & Co. and can be downloaded here.]


Here’s how normal, boring, traditional ad sales works: MediaCo sells ads on their site MediaCo.com directly to AdvertiseCo. You come to MediaCo.com, watch a video, and see one advertisement. AdvertiseCo pays MediaCo 1/1000th of a $20 CPM (or $0.02) for that ad impression. In aggregate, all of those pennies go to fund MediaCo, including the production of content which you enjoy as that diversion from your miserable existence. And over time, AdvertiseCo slowly brainwashes you down the buying funnel to the point that you’re raving to your friends about AdvertiseCo Toothpaste. If you’re like me, you might even feel a twinge of guilt when you choose not to buy Crest.

Everybody (kind of) wins.

Here’s how exciting, sexy, digital ad tech works: MediaCo can’t sell all of their ads on their site MediaCo.com directly, so they push it through to networks, exchanges, and other vendors via supply-side platforms that divvy inventory up. NetworkCo sells an ad for a $10 CPM to AdvertiseCo for men 18-34 who like sports. You come to MediaCo.com, watch a video, and see one advertisement. AdvertiseCo pays NetworkCo 1/1000th of a $10 CPM (or $0.01). NetworkCo might have to pay DataCo (who provided the audience demographic data) 10-15% of that penny, and then shares, say, 60% back to MediaCo. Maybe AdServingCo and FailingRichMediaVendorCo take a percentage too. MediaCo takes their <$0.005 and pays some fee to SupplySideCo which sent the inventory to NetworkCo in the first place. As they say in Office Space, “This sounds familiar. / Yeah, they did it in Superman III.”

So, what happens now? MediaCo tries to use this fraction of a penny to fund operations unsuccessfully, so they cut their content production costs. This leaves you less entertained and more depressed than you were before. AdvertiseCo was pretty happy with buying that ad for half as much until they realized they needed an entire DemandSideCo stack to interface with SupplySideCo and not get ripped off since 75% of NetworkCo’s ads are non-viewable. They’re selling less toothpaste than before, but have more SocialProfileCo “likes.” Meanwhile, NetworkCo, SupplySideCo, DataCo, and DemandSideCo have all filed their S-1s, and their executives are going to laugh to the bank as long as the stock maintains its value through the 180-day lock-up.

Everybody (kind of) loses. Except for the ad tech companies.

I’m sure you’ll tell me that I’m wrong: how those fractions provided by NetworkCo to MediaCo wouldn’t exist otherwise, that the $0.005 is supplementary to whatever MediaCo would sell, or that this is a radical new imagining of remnant inventory.

Bullshit.

Without ridiculously defined sales rules in place, programmatic audience sales hinder a traditional sales team’s ability to sell. The CPM floor? That’s your new maximum CPM. The provision to sell blind? A whisper in the ear from a salesperson to a media buyer. The list goes on. Networks were built to turn remnant into “gold,” but often the alchemy goes in reverse.

Or you might tell me that ad tech is a legitimate investment for a media company’s internal, first-party, sales team—providing data and results that boost CPMs by showing advertisers better, more measurable ROI.

Also, kind of, bullshit.

Yes, the level of sophistication and measurement in digital advertising will always increase, and media companies have to keep up with the demands of advertisers. However, much of this measured reality is constructed and doesn’t confer as many benefits as people might imagine. Especially for brand advertising where many of the qualities advertisers are looking to improve can’t be measured in real-time anyway. (For more info and historical context on cash register data, I recommend the Harvard Business Review article: “If Brands Are Built Over Years, Why Are They Managed Over Quarters?”)

So why should we allow NetworkCo, DataCo, SupplyCo, and DemandCo access to our data when MediaCo, with whom we have an actual commercial relationship, gets so little in return? And we haven’t even considered what happens when SocialProfileCo uses all your data to sell ads on MediaCo.com, because everyone demanded a ****ing “most shared” widget. So now SocialProfileCo gets all the money.

Did I go too far? Probably. Sorry. I know I’m being overly broad here, but you used to trade your time for content. And now you trade your time and your data for fractions of it, and ad tech companies get rich off of owning that data in the aggregate. Perhaps that continues until investors realize that everyone has the same data, declare the gross margins unsustainable, decide to stop funding an arms race without cash flow visibility, and run away from these low-multiple businesses.


I believe deeply that our use of technology can help create better experiences for consumers, creators, and advertisers. Technology has helped the human race progress in so many instances historically that we think “better” is a given.  Better isn’t an inherent quality of technology, and better doesn’t necessarily result from the market either. As I’ve noted, the relationship between society and technology runs back and forth. We have to want to create something better, not just lay in the cut.

I’ve also talked briefly about the economics of data aggregation in my ongoing series on the right to privacy, namely that our personal data is only valuable economically in the aggregate (and within context: synthesized, analyzed, measured). It’s near impossible for companies to negotiate with each of us individually. There’s even a widely held economic theory by Ronald Coase that suggests our data will end up in these companies’ hands regardless, unless we throw up what they call in the biz as transaction costs.

Here’s a transaction cost you can throw their way: Block third-party cookies. Moreover, block Facebook cookies, and use Facebook in a different browser from your regular one. At least make these companies work for it by forcing them to track your IP or your location or something else. Because they are.

And then let’s do better.

A Golden Age of Television?

ILLUSTRATION: Hippo Watching “The Mountain and the Viper” • watercolor on paper • 5×7″

We love living during Golden Ages. Try the ubiquitous Google autocomplete experiment, and type in “Golden Age of.” Then pass through the alphabet from “Athens” to “Zeppelins” to get a sense for just how many Golden Ages you’ve already lived through.[1] Thanks to the Golden Age of Hyperbole, we might even live in the Golden Age of Golden Ages.

Language being what it is, we also sometimes find ourselves in New Golden Ages —when we have been too quick to judge an earlier era’s merits—and Silver Ages—when we update the costumes of famous comic book characters—and Gilded Ages—a humorous and biting indictment of US society not incorrectly attributed to Mark Twain for once. Heck, we’ve had three New Gilded Ages in the last twenty years for those of us doomed to repeat history and bubbles and sit in traffic on the 101. But note: if you do find yourself in a Bronze Age or a Stone Age for a particular subject, it is incumbent on you to be nice and refer to it as “early innings.”

And so it’s been said that we live in a New Golden Age of Television (see here or here), but I think it’s remiss to do so as if this is merely a phenomenon of creativity, the logical necessity of talent and artistry progressing such that (legitimately wonderful) shows such as The Wire or Breaking Bad leap from the heads of their showrunning creators. Of course Steven Johnson is right when he talks about an evolution of TV complexity in Everything Bad is Good For You.[2] But befitting a Golden Age, you should do as Lester Freamon intones: Follow the money. “You don’t know where the **** it’s going to take you.” I think television content got better because a lot more money flowed into its creation, and that money got spent in more interesting ways.

Yes, over the course of the aughts, content quality fueled popularity which then fueled market growth and re-investment. But I’d argue that this era of television benefitted more from a short-term confluence of revenue growth from competing formats and competing windows, all while a fixed (or declining) amount of media time spent was fragmented across these myriad products. It’s the sustainability of these trends that we should worry about when we think of the art of scripted entertainment.


If you love TV, the sustainability of a particular kind of investment is worth discussing because even though artistic craft / progress is difficult for society or an institution to unlearn, the availability and distribution of investment can influence its flourishing. Overinvestment in one area can destroy a once vibrant art scene (Our Band Could Be Your Life-era underground -> Late-90s Grunge). A change in investment style can squander an artistic generation (00s theatrical investment in ‘franchises’ over spec scripts). And collapse can occasion the disappearance of knowledge or vibrancy. We lost the recipe for Roman concrete and Pantheon-like domes for ages after Rome’s fall, and the Renaissance sputtered to an end as the Medici Family and the Pope lost their spheres of influence. What, then, are our sources of TV patronage today?

From 2002 to 2013, US broadcast, local, and cable television advertising revenue grew from ~$58 billion to ~$74 billion. Some of that revenue flows back to content producers directly; some of it flows through local affiliate fees and syndication fees. During that same period, cable subscription revenue grew from ~$48 billion in 2002 to ~$105 billion. Revenue share flows back to broadcast and cable content producers through retransmission and carriage fees, respectively. The DVD market peaked in 2004 at $25 billion pre-Netflix, and TV box sets drove a large percentage of that. Speaking of the streaming giant, Netflix grew from zero to $5 billion in subscription revenue over this time (against an increasing amount of binge-friendly TV viewership) while YouTube grew similarly (but with only 10% going to traditional media after revenue share). You can throw in Hulu and other premium digital video advertising, Amazon Instant Video, iTunes, Google Play, Xbox Video and others’ pay-per-view and subscription revenues, too, some of which is subsidized by other, more profitable businesses.

That’s a cornucopia of overlapping revenue sources powering the creation of scripted entertainment and the acquisition / production of live sports: advertising, subscription, streaming, digital and physical retail, and other digital platforms. Investment in new platforms like streaming came while old platforms like syndication were still paying dividends. And with this new level of investment came different kinds of incentives.

For many channels, advertising no longer represented the majority of content revenue. Without having to satisfy advertisers, content creators could take on more risk with their stories. Streaming created additional library value for highly serialized stories (think 24) over episodic ones (think Law & Order) that typically ruled in syndication negotiations. The cable bundle became larger and more expensive fueling a fight for differentiation via content among a lot more players—HBO, Showtime, AMC, FX, USA, BET, Starz, ABC Family, etc.

As a result, we’ve had more pilots produced and picked up across a range of channels and products, more web series created, and an increase in budgets / cost per minute for the biggest sports and scripted spectacles from NFL games to Game of Thrones. Showrunners and talent have been given unprecedented control over the television product, mirroring the pattern of 1970s Hollywood film documented by Peter Biskind in Easy Riders, Raging Bulls. We’ve had greater diversity of product with higher production value all taking more risks than ever before in the pursuit of creative differentiation. If there were a creative equivalent of fracking, this would be it.

But what if all of that changed?


The human demand for narrative and fiction is limitless. However, over the next several years, each and every one of television’s revenue sources will transition, for good or for bad. These changes may or may not be kind to the talent or the fans of our New Golden Age of Television.

  1. Television advertising revenue may decline as time spent moves to digital platforms; at the same time, digital video advertising growth may not keep pace or may shift to non-traditional content types.
  • US broadcast and non-MSO cable advertising is broadly shaped by brand advertising dollars spent upfront chasing elusive 18-24 year-olds and moms to establish long-term spending patterns. 18-24 year-olds watch less than half as much TV as demographics above 55, so TV advertising has grown by increasing its rate card ($27 to $47 for primetime 30s) against declining audiences in these key demos and investing heavily in the few live events that can maintain broad viewership patterns. Meanwhile, YouTube delivers video advertising priced to be attractive regardless of content quality, and Facebook and others deliver video advertising to audiences without even worrying about needing pesky ol’ video content. See the YouTube report I wrote with the Jefferies & Co. Internet team here for more on this…
  1. Local affiliate and syndication revenue will very likely decline, and streaming revenue may not grow fast enough to replace it.
  • US local and MSO cable advertising is bought on spot price by hybrid brand / performance advertisers. Think car dealers, pharmaceuticals, old people scams, and during certain periods like now, politicians. This revenue comes back to content production in the form of local affiliate fees and syndication deals, but streaming, time shifting, and digital video all eat into the decidedly non-appointment viewing of Simpsons and Seinfeld reruns slapdashed into increasingly irrelevant 24-hour programming blocks. As supply shrinks, those advertisers may seek alternative, cheaper, more measurable buys…like YouTube.
  1. Cable subscription revenue to content producers (in the form of retrans and carriage fees) is at risk from plateauing subscriber growth, aforementioned youth TV trends, and alternative lower-priced streaming bundles.
  • It doesn’t seem like MSOs are in any danger of losing revenue from cord cutting, but Hollywood sure is. To the extent that MSOs ever have to focus on data uber alles, it will certainly readjust the retrans and carriage fee arrangement. And so too, assuming flat subscriber growth, how much more price elasticity is there before demand plummets? What happens if cable is unbundled? How does consumer choice in a la carte pricing influence what sort of content gets funded compared to now?
  1. A la carte streaming services such as Netflix and Amazon are obviously growing subscribers, but consumers are spending much less, even on multiple services, than cable.
  • One can subscribe to Netflix, Amazon Prime, and buy full seasons of 25 first-run shows via iTunes in HD for the cost of a $100/month cable subscription for a year. If it’s your predilection, you can replace those 25 first-run shows with 83 sporting events accompanied by beer and wings at Chili’s. So in this world, will cable revenue will be cannibalized? What happens to content quality if more people are paying closer to $7.99 per month than are paying $100+ per month for a cable bundle? Moreover, if Netflix or Amazon is the preeminent gatekeeper, what sort of content will be produced? The episode breaks of House of Cards remind me of an old Republic Pictures serial. I almost assumed like Chapter 3 of The Crimson Ghost that [spoiler alert] Kate Mara would be shown saving herself from the speeding train in the next episode after dying in the previous one.
  1. Finally, I think we all know that your used TV DVDs are on sale at Amoeba Records, and you’re waiting for the next season of your favorite show to come on Netflix instead of buying it on iTunes.
  • The now haggard DVD market supported a lot of interesting diverse content, especially one-season wonders (like Wonderfalls), which compelled content producers to take higher risk chances on those creators in the future (leading, for example, to Pushing Daisies). What happens to artist revenue when we choose to subscribe versus support it directly? If video follows music, the money flowing to content production will decline.

Look, I’m generally bullish on the outlook for scripted content, as a popular form of entertainment and as an art form. I would love to make something someday. And it could be that the economics of the revenue sources in the list above are unevenly distributed now yet reflect an actual and consistent economic demand to be redistributed as trends wax and wane. But three things keep occurring to me…

First, we won’t be able to pay $7.99 per month for Netflix plus scrape by with Amazon Prime and YouTube and be able to expect the same quality of content we experienced during this New Golden Age.

Second, we should be careful what we wish for when we ask to unbundle things. The economics may be distributed more “fairly,” but also we may end up unhappily watching “Where Are My Pants?” or “Ow, My Balls.” (Or maybe writing on our blogs to no one. I’m very interested in bundling, unbundling, and rebundling as a broader economic trend in our society, and I plan to write more on this soon.)

Finally, nothing lasts forever—no episode, no season, no series, no Golden Age. To quote the Hagakure once again: “It is said that what is called ‘the spirit of an age’ is something to which one cannot return. That this spirit gradually dissipates is due to the world’s coming to an end. For this reason, although one would like to change today’s world back to the spirit of one hundred years or more ago, it cannot be done. Thus it is important to make the best out of every generation.”

On that note, The Wire ended more than six years ago. It’s probably time for me to let it go. We can all start talking about the Golden Age of Netflix or YouTube now. Oh wait.

[1] Speaking of Athens and Zeppelin, I’ve heard the Golden Age of Athens looked a lot like the album cover “Houses of the Holy.” [insert rimshot]

[2]  I’ll tell the story of Steven Johnson explaining his thesis to a roomful of incredulous, fancy art patrons in the Berkshires another time.